
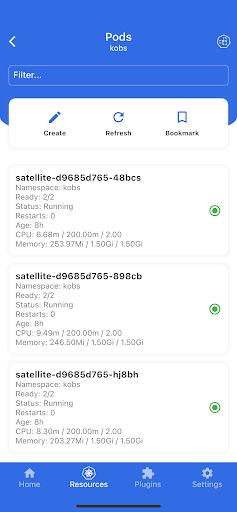
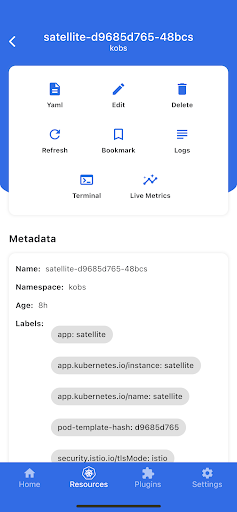
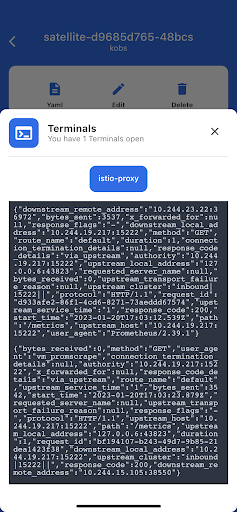
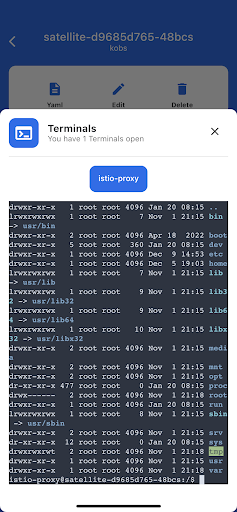
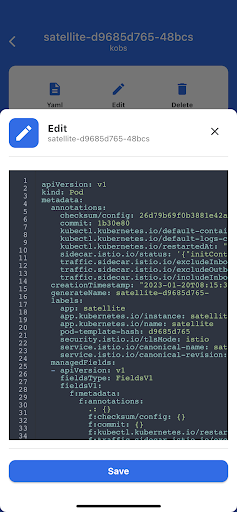
kubenav - Kubernetes Dashboard is a compact, cross-platform tool that brings cluster inspection and everyday operations into a single, consistent interface for phones, tablets and laptops. kubenav - Kubernetes Dashboard provides an at-a-glance cluster overview plus detailed resource screens so you can quickly review Deployments, Pods, StatefulSets and Custom Resource Definitions; when a deeper investigation is needed the app surfaces live logs, event streams and an interactive container shell for hands-on debugging, all from the same workflow.
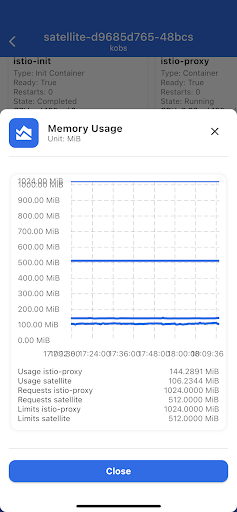
Browse core Kubernetes objects and CRDs with context-aware detail pages that group metadata, spec and status together with recent events and related conditions. Common management actions are supported inline: edit manifests, delete resources, scale workloads and create port-forwards to reach in-cluster services. Live log streaming lets you tail container output in real time, and an integrated shell provides terminal access to containers when network and RBAC policies permit. If a Prometheus endpoint is available, kubenav can surface metric charts alongside resource details so you can correlate logs and events with basic monitoring graphs without switching tools.
The interface supports a near-identical workflow across form factors: touch-first controls and long-press gestures on mobile and familiar mouse/keyboard interactions on desktop. Navigation follows a predictable tree and list model where clusters, contexts and namespaces are easy to select; resource lists support sorting, filtering and label queries so you can narrow results by name, label or status. Desktop users benefit from keyboard navigation and contextual menus for fast operations while mobile users rely on tap targets, intuitive back-stack navigation and compact detail cards to reach the same capabilities with minimal friction.
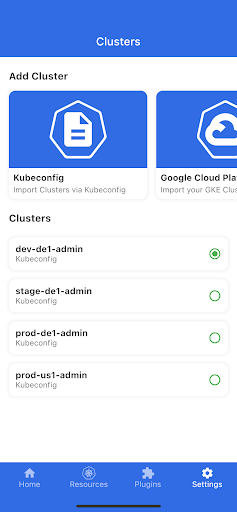
Initial setup typically involves adding clusters via kubeconfig files or supported cloud provider authentication. The app encourages a clear progression for new users: add a cluster, review the status dashboard, inspect suspect pods and use logs or an integrated shell to triage, then apply edits or scaling changes as needed. kubenav stores cluster connections so you can keep multiple clusters available for quick comparison; switching contexts and namespaces is designed to be fast so recurring operational patterns become more efficient over time.
The design emphasizes compact, information-dense views that prioritize actionable fields and health indicators. Resource lists expose essential columns and status badges, while detail pages group related information into sections you can scan or expand. Layouts adapt between small and large screens: summary cards and collapsible sections reduce visual clutter on phones while full details and wider tables are presented on larger displays. Users can adjust display density, choose which columns are visible and set a preferred theme to balance readability and information density for their workflow.
On-device management simplifies many troubleshooting tasks, but several capabilities depend on cluster configuration and policy. RBAC may restrict actions like opening a shell or creating a port-forward, and network topology determines reachability. The app requires valid credentials and does not bypass cluster security. When connectivity is intermittent, kubenav preserves recently fetched summaries and resource lists for brief read-only inspection so you can review recent state, but full management actions require an active connection and authentication to the target cluster.
Accessibility features include support for large text sizes, clear focus states, predictable navigation patterns and compatibility with screen readers to help keyboard and assistive technology users. Touch targets and gestures are sized and timed to reduce accidental input on small screens. Error messages and event displays aim to be concise and actionable so triage steps are clearer, and onboarding tips guide users through common workflows until the app becomes part of routine operations.
This app is aimed at engineers and operators who need a single, consistent interface for routine Kubernetes tasks: quick diagnostics on the go, switching between multiple clusters, or keeping an eye on workload health without launching a full desktop environment. The focus is on efficient access to logs, events, resource details and basic control actions rather than replacing comprehensive CI/CD or policy systems, making it suitable for day-to-day maintenance, incident triage and lightweight cluster inspections.
To use the app you must supply access credentials for the clusters you want to manage, either via kubeconfig or supported cloud provider authentication. Prometheus integration requires an existing Prometheus deployment to surface metrics. Expect some feature behavior to be limited by the cluster's RBAC rules and network configuration. The app prioritizes operational clarity and performance so repeated tasks become faster with familiarity, and the cached read-only views help maintain usability when connectivity fluctuates.