Candlestick Charts & Simulator APK

Candlestick Charts & Simulator

1.0 for Android
4.0

Tags: Action

Description

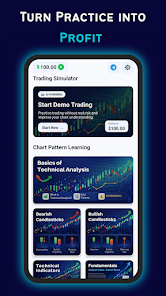
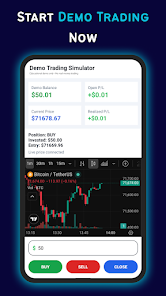
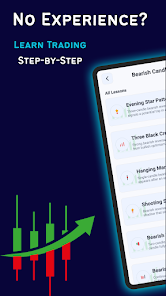
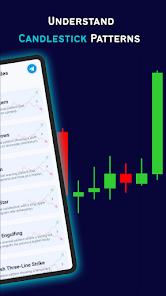
Candlestick Charts & Simulator helps traders and learners analyze market price action with interactive candlestick charts and a built-in simulator for paper trading and strategy testing.

Overview

Candlestick Charts & Simulator displays multiple timeframes, adjustable chart settings, and annotations so you can study patterns, spot trends, and evaluate entries and exits without risking real capital.

Key features

  • Interactive candlestick charts with zoom, pan, and replay controls
  • Built-in simulator for paper trades and strategy testing
  • Multiple timeframes and chart styles
  • Common technical indicators: moving averages, RSI, MACD and more
  • Drawing tools for support, resistance and pattern annotation
  • Import historical data and export session logs for review
  • Performance summary and trade history to track simulated results

Getting started

To begin, open Candlestick Charts & Simulator, choose a market and timeframe, add indicators or drawings, and run the simulator to practice strategies using historical or replay data.

Information

  • Category:
    Puzzle
  • Latest Version:
    1.0
  • Updated:
    2026-04-15
  • File size:
    35.00MB
  • Requirements:
    Android
  • Developer:
    TradeBee Fintech
  • ID:
    com.candlestickchart.learndemotrading
  • Language:
    English